
Have you ever needed to check how this month's sales compare to last month's? Or maybe you're interesting in more detailed calculations, like adding up total or finding a moving average over a period of 3, 6, or 12 months. If this is the case, then you need to use what Power BI called "time intelligence" functions when working with dates.
By understanding how to use these functions effectively, you'll be able to make comparisons and spot differences in your data over different time periods. This will help you discover trends and patterns in your data, which can be really useful for making informed decisions.
Essentially, there are two ways to approach this - using Power BI's in-built time intelligence feature, or by having a separate date table in your data model (aka. the right way!). You might think that your data model doesn't require a date table but you'll soon run into limitations of not setting one up. Often, new people to DAX don't appreciate the benefits of adding such a table and stick with Power BI time intelligence. Let's first explore that, run into the limitations that people invariably do, and then move on to best practice - a separate date table in the data model.
Power BI Time-intelligence
If you have a column with the date data type in your model, Power BI will create a date table in the background for each date type column it finds. You'll find that when you drag a date attribute into a visualisation, Power BI will apply the "time intelligence" to it. You'll see this through what is called "Auto date/time" like the below example:
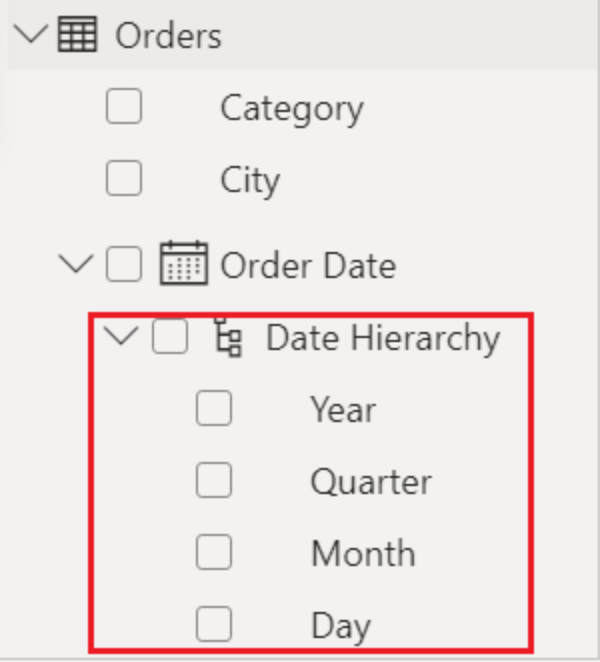
The above shows that you can group data (for example, Sales Revenue) into different periods or groupings of time - Year, Quarter, Month, Day. Anything more than this and you start to run into limitations for your data analysis.
- What if your financial year isn't January to December?
- What if you want to compare total 2022 sales with total 2023 sales?
- What if you work in an industry where weeks don't start on Mondays and end on Sundays, and you need to analyze data based on your specific week definitions?
- What if you want to compare sales in a flexible way, not just between specific years, but between dynamic periods like the last 12 months or rolling quarters?
- What if you need to incorporate additional date-related attributes like day of the week, month names, or public holidays into your analysis?
The above are just a few questions that the business might ask of your data, and questions that are either impossible or would require significant DAX calculations to attempt to get around these limitations. Luckily, the answer is setting up your own date table and turning off Auto Date/Time in Power BI.
Creating a Date table
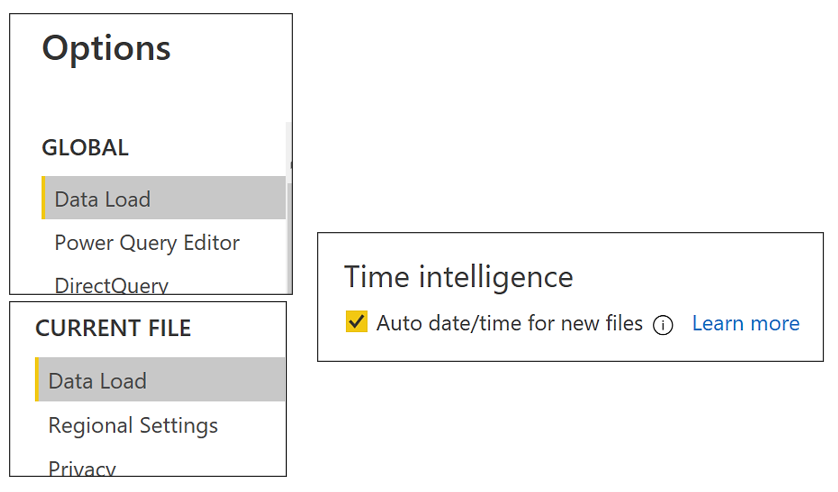
The first thing you need to do is turn off the Auto date/time feature in Power BI. There are actually two places to do this and I advise to do both. In the Options, Click on 'Data Load' underneath the GLOBAL section to ensure that the setting applies to all subsequent Power BI files. You also need to disable it in the current file too.
The best article to help explain how to set up a simple date table can be found using the following link:

I strongly recommend Bravo for Power BI - a powerful toolkit to analyse your models, format measures, create date tables, and export data.
You could even create a date table in Excel for full flexibility. If you do this, you need to ensure that you have the mandatory column that lists sequential dates to cover the entire span of your data - you must include all dates even if there's no data for specific dates. All the other columns in your date table are there to simply categorise or group dates in whichever particular way you want. You could have columns such as week_number, weekday (0 or 1), year_month, (e.g 2023_11), day_name, month_name, fiscal_month_number, and the list goes on.
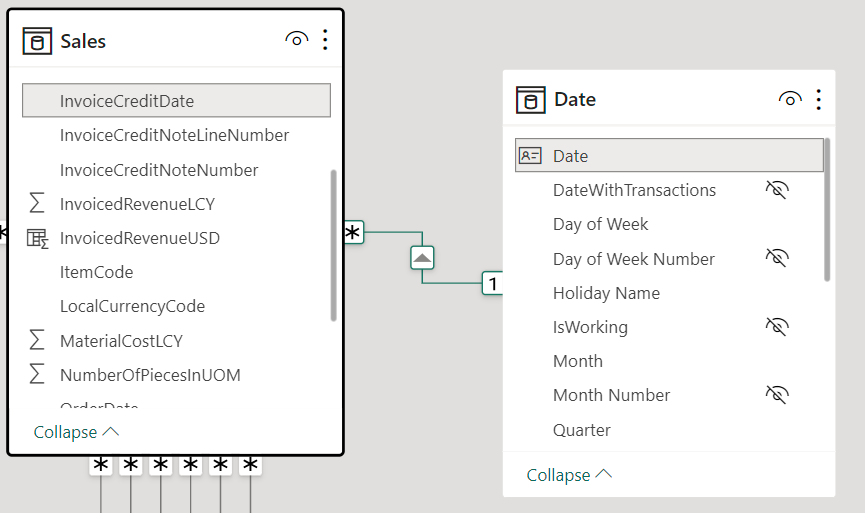
Once you have this table in your model, you need to establish the relationship with your factual table. In the example below, you can see that Date is linked to SalesInvoiceDate in the Sales table.
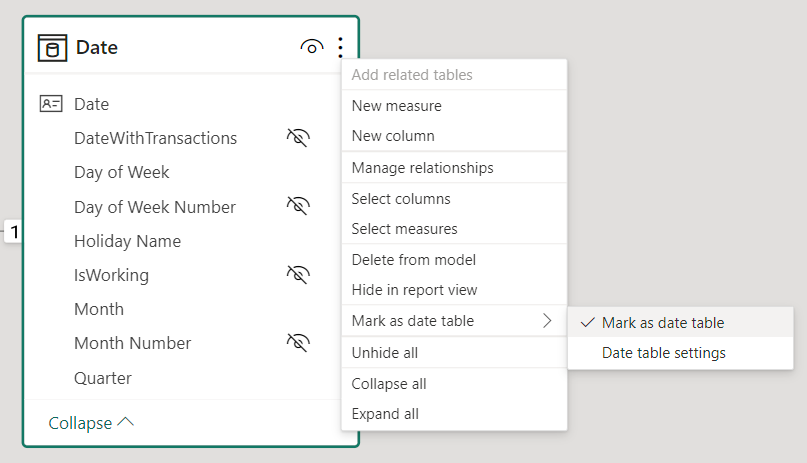
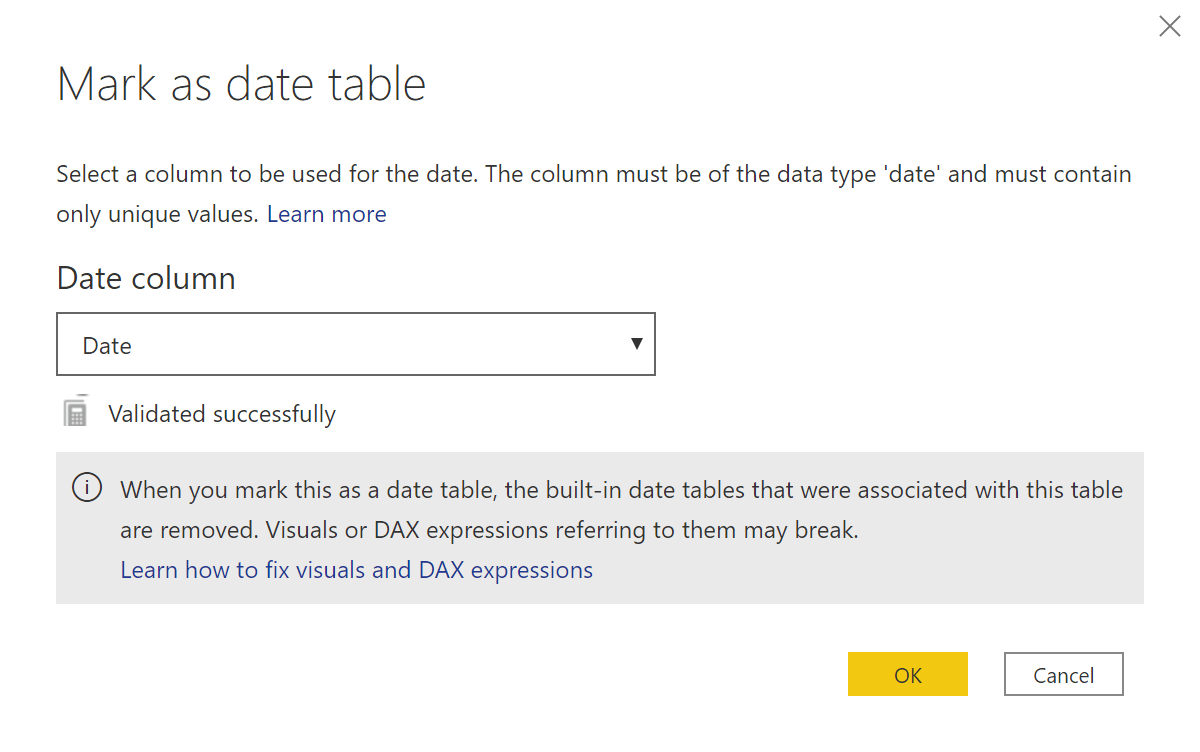
You also need to ensure that your data model knows that this date table is the date table for the model. This is done from the 'Table Tools' tab by selecting 'Mark as date table'. In the "Date column", select the column in your date table that contains the list of unique dates.
It's worth reading up this "Mark as date table" function from the following article:
Conclusion
In a nutshell, while Power BI's built-in time intelligence functions offer convenience, they come with limitations when handling complex data analysis tasks. To achieve greater flexibility and robust capabilities, it's advisable to create a separate date table in your data model. By turning off the Auto date/time feature and establishing the necessary relationships, you can harness the full potential of time-based insights, enabling you to make more informed decisions, track trends, and compare data across various time periods with ease.


