
As a huge Formula 1 fan, I was very happy to find a dataset on Kaggle that has lots of stats for seasons from 1950 to 2021. I decided to try an encorporate some SQL into this rather than load all of the .csv files straight into my Python IDE. Looking at the results.csv, we can see that most columns are filled with IDs which then links to the data held in different tables. This was a great opportunity to clean the data, replace these IDs with the actual data (by utilising LEFT JOIN), and then import the resulting .csv straight into VSCode. Doing this means we can use the power of SQL and and have a better starting position for our analysis in Python.
The original dataset has the following files:
- circuits.csv
- constructor_results.csv
- constructor_standings.csv
- constructors.csv
- driver_standings.csv
- drivers.csv
- lap_times.csv
- pit_stops.csv
- qualifying.csv
- races.csv
- results.csv
- races.csv
- seasons.csv
- sprint_results.csv
- status.csv
We will write the below SQL statement in order to grab the required data that we want from the various csv files. There's a bit of cleanup we can do within the statement too.
USE f1_db
SELECT
  --results.resultId,
  results.number AS car_number,
    RTRIM(
    LTRIM(
      CONCAT(
        COALESCE(drivers.forename + ' ', ''),
        COALESCE(drivers.surname, '')
      )
    )
  ) AS driver_name,
  drivers.nationality AS driver_nationality,
  CAST(drivers.dob as date) AS driver_dob,
  results.grid AS start_pos,
  CASE WHEN results.position = '\N' THEN 'DNF' ELSE results.position END AS finish_pos,
  results.points,
  results.laps AS laps_done,
  CASE WHEN results.fastestLapTime = '\N' THEN 'DNF' ELSE results.fastestLapTime END AS fastest_lap,
  status.status AS result_status,
  races.round AS season_round,
  CAST(races.date as date) AS race_date,
  races.year AS race_year,
  races.name AS race_name,
  circuits.name AS track_name,
  circuits.location AS race_location,
  circuits.country AS race_country,
  constructors.name AS constructor
FROM
  results
  LEFT JOIN.status ON status.statusId = results.statusId
  LEFT JOIN races ON races.raceId = results.raceId
  LEFT JOIN circuits ON circuits.circuitId = races.circuitId
  LEFT JOIN drivers ON drivers.driverId = results.driverId
  LEFT JOIN constructors ON constructors.constructorId = results.constructorId
This changes our output from the below...
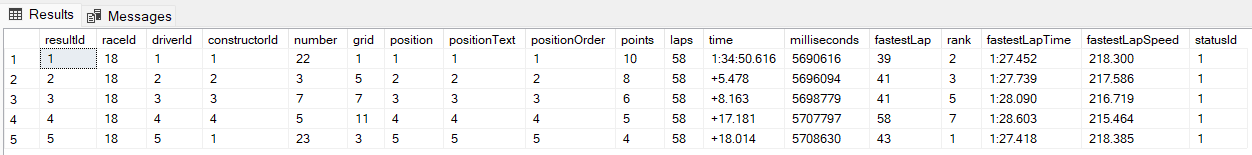
to a more useful table with data from accompanying tables:

Let's now move over to Visual Studio Code:
# Importing some tools that we will need throughout our analysis

import pandas as pd
import numpy as np
import matplotlib.pyplot as plt
%matplotlib inline
import matplotlib.patches as mpatches
from matplotlib.pyplot import figure
import matplotlib.mlab as mlab
import scipy.stats
# Reading in the data we extracted via our SQL statement
f1 = pd.read_csv('f1.csv')f1.head(10)car_number | driver_name | driver_nationality | driver_dob | start_pos | finish_pos | points | laps_done | fastest_lap | result_status | season_round | race_date | race_year | race_name | track_name | race_location | race_country | constructor | |
|---|---|---|---|---|---|---|---|---|---|---|---|---|---|---|---|---|---|---|
| 0 | 22 | Lewis Hamilton | British | 1985-01-07 | 1 | 1 | 10.0 | 58 | 1:27.452 | Finished | 1 | 2008-03-16 | 2008 | Australian Grand Prix | Albert Park Grand Prix Circuit | Melbourne | Australia | McLaren |
| 1 | 3 | Nick Heidfeld | German | 1977-05-10 | 5 | 2 | 8.0 | 58 | 1:27.739 | Finished | 1 | 2008-03-16 | 2008 | Australian Grand Prix | Albert Park Grand Prix Circuit | Melbourne | Australia | BMW Sauber |
| 2 | 7 | Nico Rosberg | German | 1985-06-27 | 7 | 3 | 6.0 | 58 | 1:28.090 | Finished | 1 | 2008-03-16 | 2008 | Australian Grand Prix | Albert Park Grand Prix Circuit | Melbourne | Australia | Williams |
| 3 | 5 | Fernando Alonso | Spanish | 1981-07-29 | 11 | 4 | 5.0 | 58 | 1:28.603 | Finished | 1 | 2008-03-16 | 2008 | Australian Grand Prix | Albert Park Grand Prix Circuit | Melbourne | Australia | Renault |
f1['driver_dob'] = pd.to_datetime(f1['driver_dob'])
f1['race_date'] = pd.to_datetime(f1['race_date'])
# We might want to do some analysis on driver ages so let's grab that by finding their age based on date of birth and date of race.
f1['race_age'] = (f1['race_date'] - f1['driver_dob']).astype('timedelta64[Y]')wins = f1[(f1.finish_pos == '1')]
wins_age = wins['race_age']num_bins = 30
n, bins, patches = plt.hist(wins_age, num_bins, facecolor='#367fa9')
plt.title('At what age are you most likely to win?')
plt.xlabel('Driver Age')
plt.ylabel('Number Of Wins')
plt.show()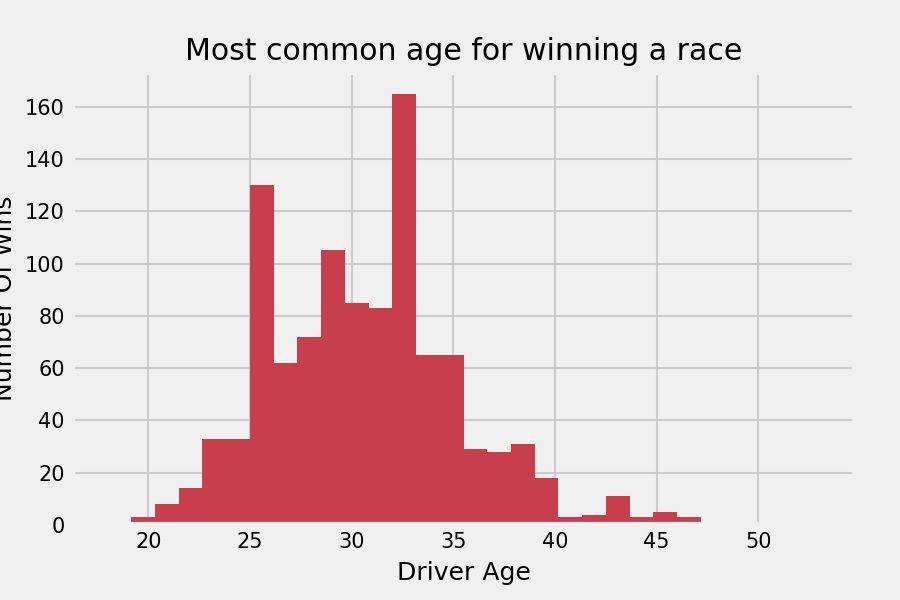
rounds = f1.groupby('race_year').season_round.max().reset_index()['season_round'].tolist()
years = f1.groupby('race_year').season_round.max().reset_index()['race_year'].tolist()

fig, ax = plt.subplots(figsize=(15,5))
ax.plot(years, rounds)

ax.set_ylabel("NUMBER OF RACES")
ax.set_xlabel("YEAR")
plt.title('Number Of Races Held Per Year')
plt.xlabel('Year')
plt.ylabel('Number Of Races')
plt.savefig("races_per_year.png",dpi=150)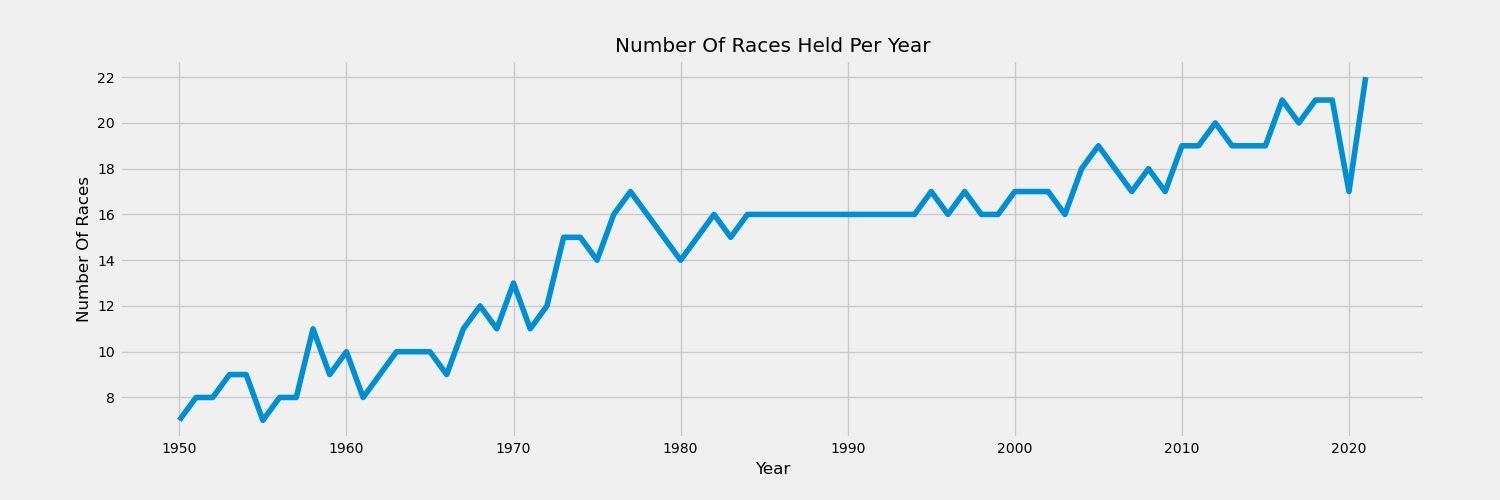
avg_ages = f1.groupby('race_year')['race_age'].mean()

fig, ax = plt.subplots(figsize=(15,5))
ax.plot(years, avg_ages)
plt.ylim([25, 40])

plt.gca().spines["top"].set_visible(False)
plt.gca().spines["right"].set_visible(False)

plt.ylabel("AVG DRIVER AGE")
plt.xlabel("RACE YEAR")
plt.title('Average Age Of Drivers Over Time')
plt.savefig("avg_age_year.png",dpi=150)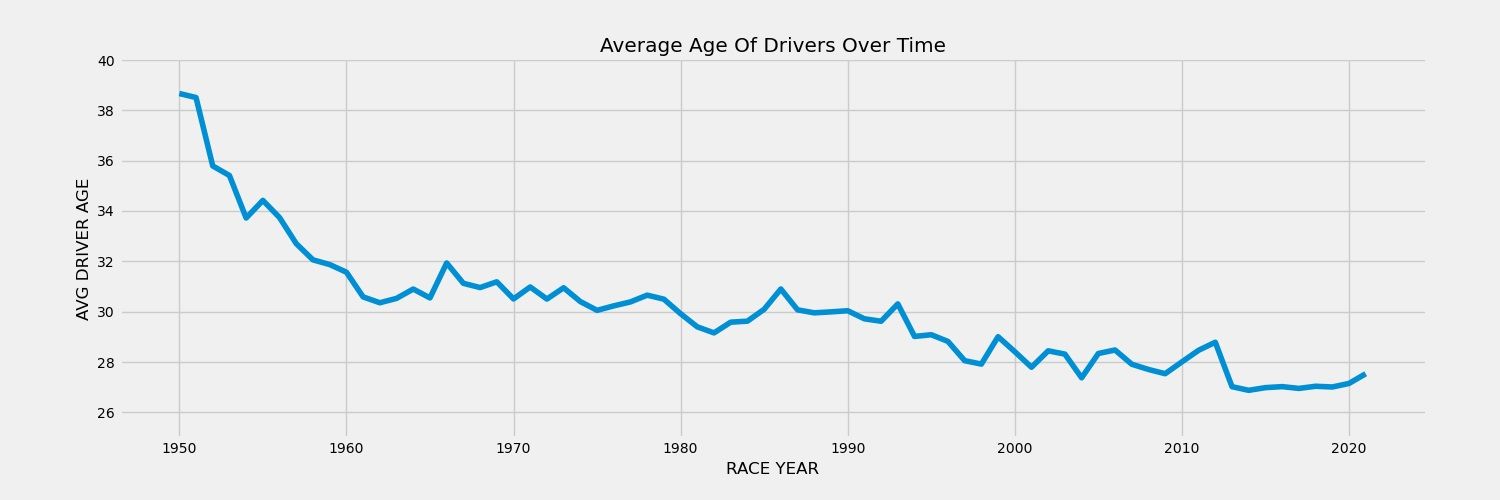
constructor_wins = wins.groupby('constructor')['constructor'].count().sort_values(ascending=False).reset_index(name="race_wins").head(15)

plt.figure(dpi=100)
plt.bar(constructor_wins['constructor'], constructor_wins['race_wins'], color='#C83E4D')
plt.gca().spines['top'].set_visible(False)
plt.gca().spines['right'].set_visible(False)
plt.xticks(rotation=90)
plt.ylabel('RACE WINS', y=0.9)
plt.xlabel('CONSTRUCTOR', x=0.1)
plt.suptitle('Top 15 constructors by race wins (1950 - 2021)', x=0.35)
plt.figtext(0.9, -0.2, 'Data Source: shorturl.at/kxCU6', horizontalalignment='right', fontsize=6)
plt.savefig("top_constructors.png",dpi=150)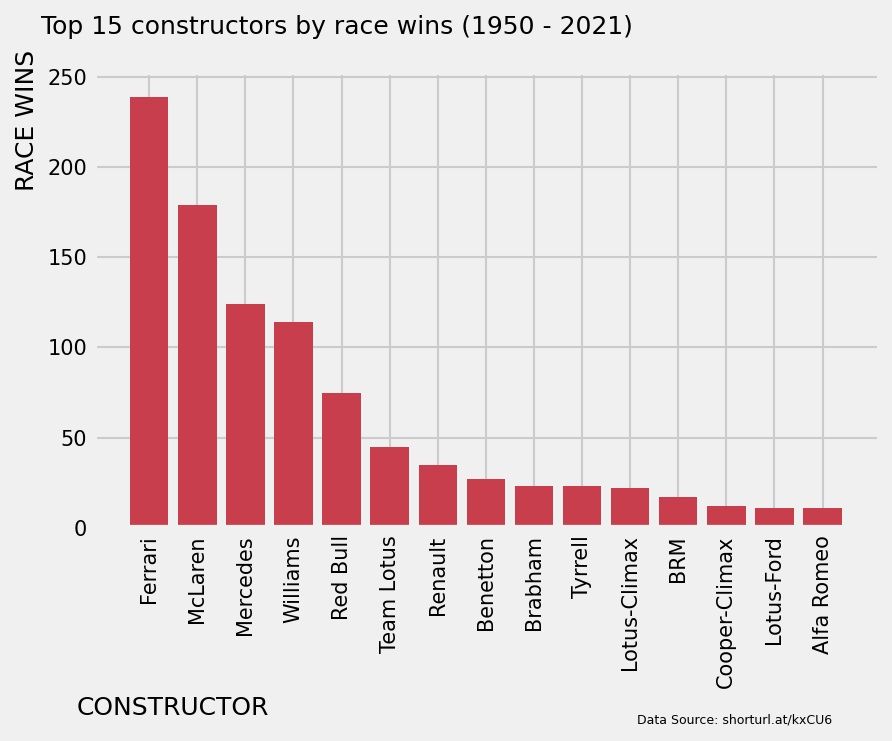
# Number of wins in f1 by each nationality
winner_nationalities = wins.groupby('driver_nationality')['driver_nationality'].count().sort_values(ascending=False).reset_index(name="race_wins").head(15)
plt.figure(dpi=100)
plt.bar(winner_nationalities['driver_nationality'], winner_nationalities['race_wins'], color='#C83E4D')
plt.gca().spines['top'].set_visible(False)
plt.gca().spines['right'].set_visible(False)
plt.xticks(rotation=90)
plt.ylabel('RACE WINS', y=0.9)
plt.xlabel('DRIVER NATIONALITY', x=0.1)
plt.suptitle('Top 15 nationalities by race wins (1950 - 2021)', x=0.35)
plt.figtext(0.9, -0.2, 'Data Source: shorturl.at/kxCU6', horizontalalignment='right', fontsize=6)
plt.savefig("top_nationalities.png",dpi=150)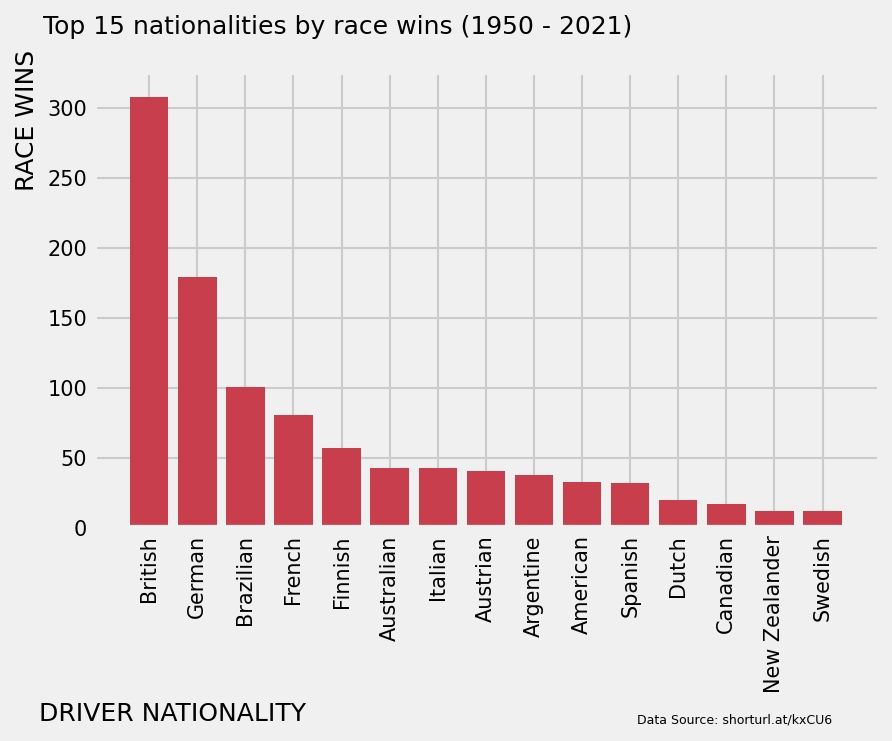
constructor_winsbyyear = wins.groupby(['race_year','constructor'])['constructor'].count().reset_index(name="race_wins")
constructor_winsbyyear = constructor_winsbyyear[(constructor_winsbyyear.constructor == 'Ferrari') | (constructor_winsbyyear.constructor == 'McLaren') | (constructor_winsbyyear.constructor == 'Williams') | (constructor_winsbyyear.constructor == 'Red Bull')]
plt.figure(figsize=(16,10), dpi= 80)
sns.lineplot(data=constructor_winsbyyear, x="race_year", y="race_wins", hue="constructor")
plt.ylim(0,25)
plt.ylabel('RACE WINS', y=0.9)
plt.xlabel('RACE YEAR', x=0.1)
plt.title('Race Wins For The Top 4 Constructors By Year', x=0.2)
plt.savefig("top_4_constructors.png",dpi=150,bbox_inches='tight')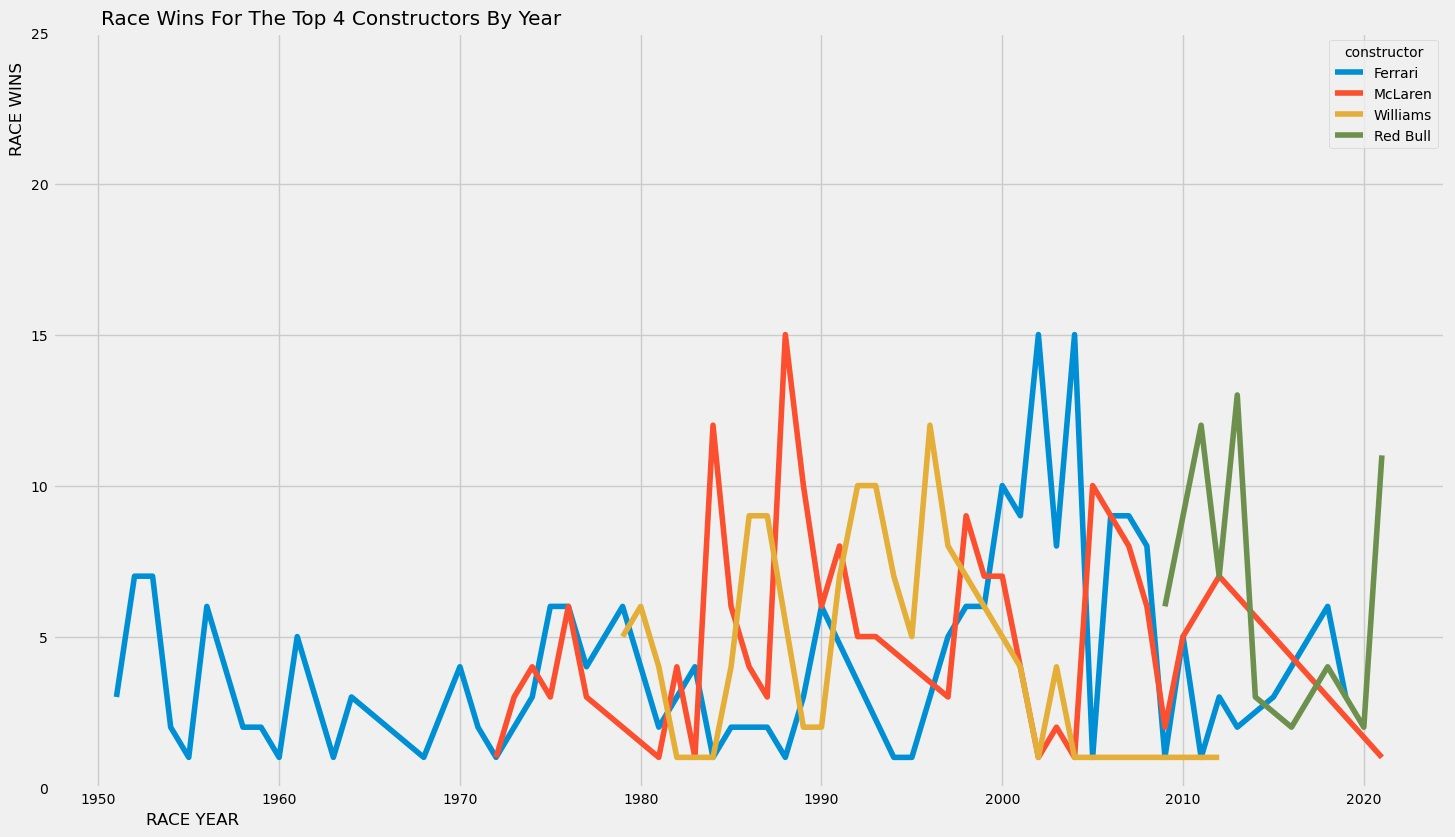
In the data, there's information on whether a car finished a race or not. If it hadn't, then it details the reason for the DNF. I will look into doing something with this data if I revisit this project. For now, thanks for reading!
dnfs = f1[(f1.finish_pos == 'DNF') & (f1.result_status != 'Did not prequalify') & (f1.result_status != 'Did not qualify')]
dnfs = dnfs.groupby(['race_year','result_status'])['result_status'].count().reset_index(name="count")
dnfs['status_percentage'] = dnfs['count'] / dnfs.groupby('race_year')['count'].transform('sum')
dnfs['status_percentage'] = dnfs['status_percentage'].astype(float).map("{:.2%}".format)

engines = dnfs[(dnfs.result_status == 'Engine')]
accidents = dnfs[(dnfs.result_status == 'Accident')]


