
Continuing my learning journey of Python (and tools) in data analysis, I found a good dataset on Kaggle that has Olympics medals data of each participating country since 1896.
The information on the data reads:
The modern Olympic Games or Olympics are the leading international sporting events featuring summer and winter sports competitions in which thousands of athletes from around the world participate in a variety of competitions. The Olympic Games are considered the world's foremost sports competition with more than 200 nations participating. The Olympic Games are normally held every four years, and since 1994, has alternated between the Summer and Winter Olympics every two years during the four-year period.
So, let's begin:
import pandas as pd
import numpy as np
import matplotlib.pyplot as plt
%matplotlib inline
import matplotlib.patches as mpatches
from matplotlib.pyplot import figure
import matplotlib.mlab as mlab
import scipy.stats
import seaborn as sns
df = pd.read_csv('olympics_medals.csv')
df.head(10)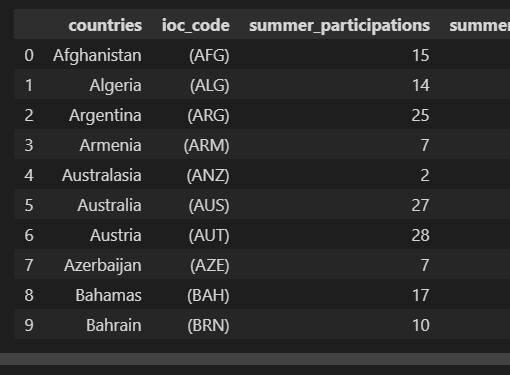
df.info()RangeIndex: 156 entries, 0 to 155
Data columns (total 17 columns):
# Column Non-Null Count Dtype
--- ------ -------------- -----
0 countries 156 non-null object
1 ioc_code 156 non-null object
2 summer_participations 156 non-null int64
3 summer_gold 156 non-null object
4 summer_silver 156 non-null int64
5 summer_bronze 156 non-null int64
6 summer_total 156 non-null object
7 winter_participations 156 non-null int64
8 winter_gold 156 non-null int64
9 winter_silver 156 non-null int64
10 winter_bronze 156 non-null int64
11 winter_total 156 non-null int64
12 total_participation 156 non-null int64
13 total_gold 156 non-null object
14 total_silver 156 non-null int64
15 total_bronze 156 non-null int64
16 total_total 156 non-null object
dtypes: int64(11), object(6)
memory usage: 20.8+ KB#removing the comma from the the numerical string data and changing to int64 format
df['summer_gold'] = df['summer_gold'].str.replace(',','').astype('int64')
df['summer_total'] = df['summer_total'].str.replace(',','').astype('int64')
df['total_gold'] = df['total_gold'].str.replace(',','').astype('int64')
df['total_total'] = df['total_total'].str.replace(',','').astype('int64')#stripping the ioc code from its brackets
df['ioc_code'] = df['ioc_code'].str.replace('(', '')
df['ioc_code'] = df['ioc_code'].str.replace(')', '')#Checking correlation across the data points
plt.figure (figsize = (18,12))
sns.set_style('ticks')
corr = df.corr()
sns.heatmap (data = corr, annot = True, fmt= " .2g", linewidth = 2)
sns.set (font_scale = 0)
plt.show ()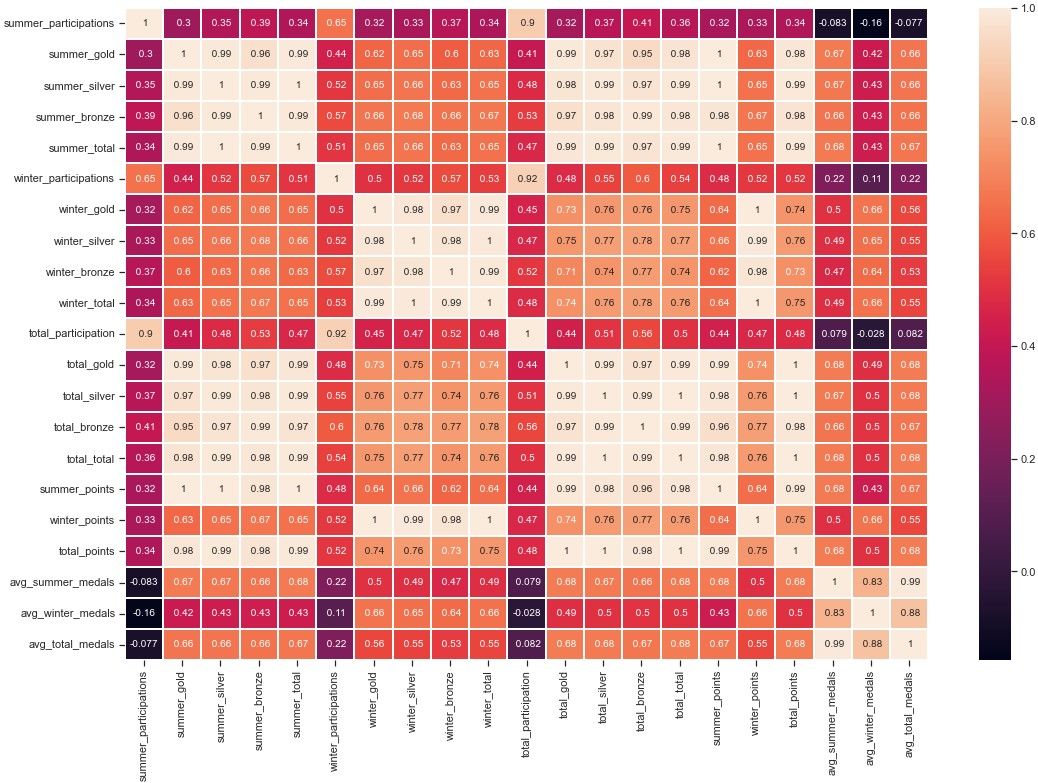
This correlation map shows a strong correlation between countries that participate and countries that win the most medals. There's also quite a strong correlation between total summer participations and total winter participations (0.65). There's a stronger correlation between number of winter particpations & medals won at the winter games (0.53), than there is between total summer participations & medals won at the summer games (0.34).
Taking this further, let's see if there's a test the hypothesis that the more Summer Olympics you participate in, the more you will win medals
f, axs = plt.subplots(2, 2, figsize=(10, 10), gridspec_kw=dict(width_ratios=[4, 4]))
sns.set_style('ticks')
sns.scatterplot( data=df, x="summer_participations", y="summer_gold", ax=axs[0,0])
sns.scatterplot( data=df, x="summer_participations", y="summer_silver", ax=axs[0,1])
sns.scatterplot( data=df, x="summer_participations", y="summer_bronze", ax=axs[1,0])
sns.scatterplot( data=df, x="summer_participations", y="summer_total", ax=axs[1,1])
f.tight_layout()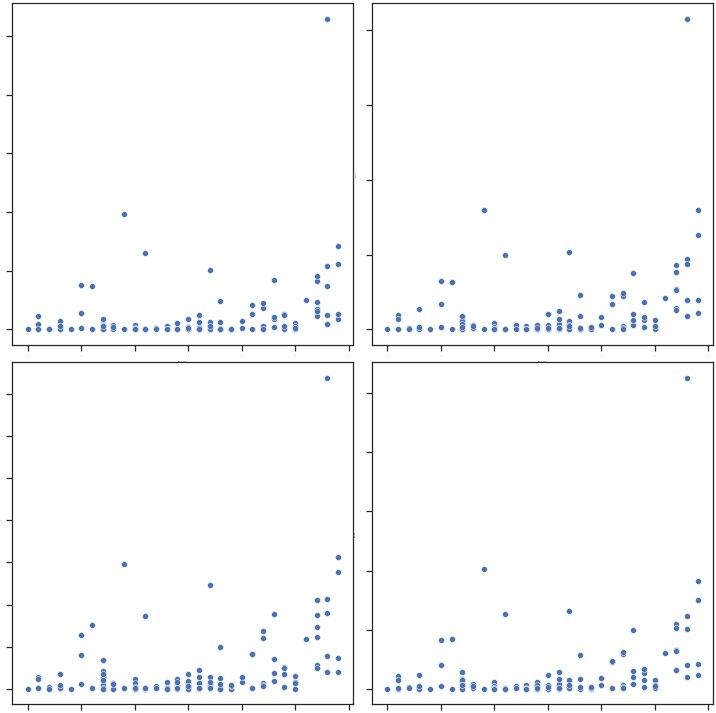
Looking at the scatterplots above, it doesn't show any strong correlation.
Counting the number of medals won at the Olympics may not be the fairest system of determining the most successful countries. For example, at the 2008 Olympic Games in Beijing, the USA finished second in the gold count to China, but were ahead of them in the total medal count. This created quite a bit of discussion about which ranking system should be used. The Americans were obviously quite happy with their usual system of counting total medals, but the rest of the world generally did not agree.
For this project, I am using the New York Times weighted point system (4:2:1) — gold 4 points, silver 2 points, and bronze 1 point. An exponential points system giving ' Medal Points' described in the New York Times in 2008.
df['summer_points'] = df['summer_gold'] * 4
df['summer_points'] += df['summer_silver'] * 2
df['summer_points'] += df['summer_bronze']

df['winter_points'] = df['winter_gold'] * 4
df['winter_points'] += df['winter_silver'] * 2
df['winter_points'] += df['winter_bronze']

df['total_points'] = df['summer_points'] + df['winter_points']

df.head(10)
It might be interesting to see how well a country performs on average. A country that takes part in more Olympics will have a better chance than a country participating in less. Let's create some "average medals" columns to assess performance later on.
df['avg_summer_medals'] = df['summer_total'] / df['summer_participations']
df['avg_winter_medals'] = df['winter_total'] / df['winter_participations']

df['avg_total_medals'] = df['total_total'] / df['total_participation']

cols = ['avg_summer_medals', 'avg_winter_medals', 'avg_total_medals']
df[cols] = df[cols].round(1)
summer = df[['countries', 'ioc_code', 'summer_participations', 'summer_gold', 'summer_silver', 'summer_bronze', 'summer_total', 'summer_points', 'avg_summer_medals']]
summer = summer.sort_values(by='summer_points', ascending=False)
summer.head(10)winter = df[['countries', 'ioc_code', 'winter_participations', 'winter_gold', 'winter_silver', 'winter_bronze', 'winter_total', 'winter_points', 'avg_winter_medals']]
winter = winter.sort_values(by='winter_points', ascending=False)
winter.head(10)summer_top20 = summer.head(20)
plt.figure(dpi=100)
plt.bar(summer_top20['countries'], summer_top20['summer_points'], color='#C83E4D')
plt.gca().spines['top'].set_visible(False)
plt.gca().spines['right'].set_visible(False)
plt.xticks(rotation=90)
plt.ylabel('SUMMER POINTS', y=0.9)
plt.xlabel('COUNTRY', x=0.1)
plt.suptitle('Top 20 Countries in Summer Olympics', x=0.35)
plt.savefig("top_summer_points.png",dpi=150)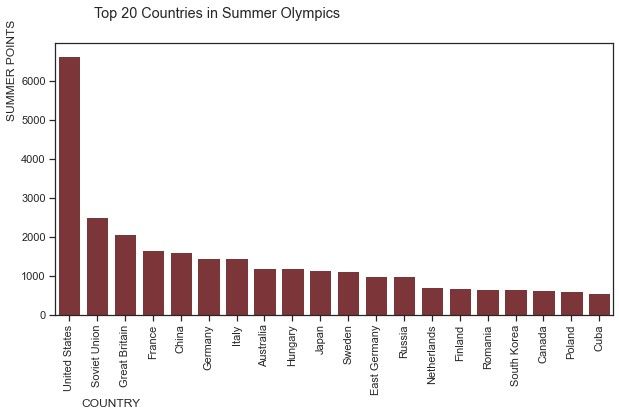
winter_top20 = winter.head(20)
plt.figure(dpi=100)
plt.bar(winter_top20['countries'], winter_top20['winter_points'], color='#367fa9')
plt.gca().spines['top'].set_visible(False)
plt.gca().spines['right'].set_visible(False)
plt.xticks(rotation=90)
plt.ylabel('WINTER POINTS', y=0.9)
plt.xlabel('COUNTRY', x=0.1)
plt.suptitle('Top 20 Countries in Winter Olympics', x=0.35)
plt.savefig("top_winter_points.png",dpi=150)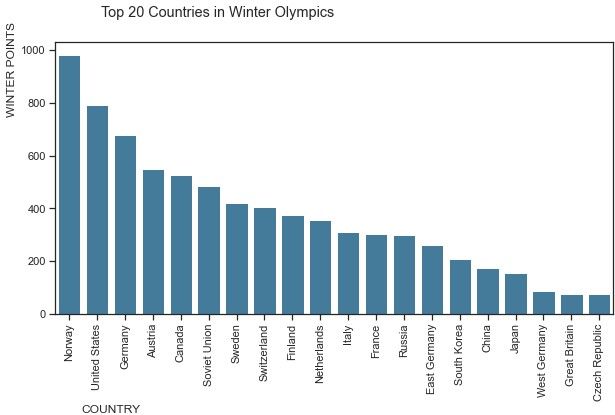
total_top20 = total.head(20).sort_values(by='total_points', ascending=False)
plt.figure(dpi=100)
plt.bar(total_top20['countries'], total_top20['total_points'], color='#FFC145')
plt.gca().spines['top'].set_visible(False)
plt.gca().spines['right'].set_visible(False)
plt.xticks(rotation=90)
plt.ylabel('TOTAL POINTS', y=0.9)
plt.xlabel('COUNTRY', x=0.1)
plt.suptitle('Top 20 Countries in the Olympics (combined)', x=0.35)
plt.savefig("top_total_points.png",dpi=150)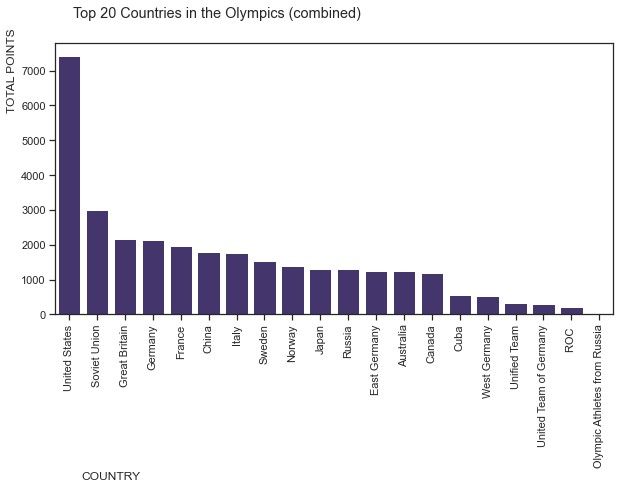
Lets get back to the average of medals won. We're going to call this a country's 'efficiency rate' for simplicity. Remember, this is calculated by dividing the number of participations by the number of medals won.
top20_avg_medals_total = df[["avg_total_medals", "countries"]].groupby(["countries"]).first().sort_values(by = "avg_total_medals", ascending = False).head(20)

plt.figure(figsize = (10,5))
sns.set_style('ticks')
color = ['#3f2d76']
sns.barplot (data = top20_avg_medals_total, x = top10_avg_medals_total.index, y = 'avg_total_medals', palette=color)
sns.set(font_scale=1)
plt.xticks (rotation = 80)
plt.title ("Top 20 Countries With A Better Participation/Medals Average")
plt.show()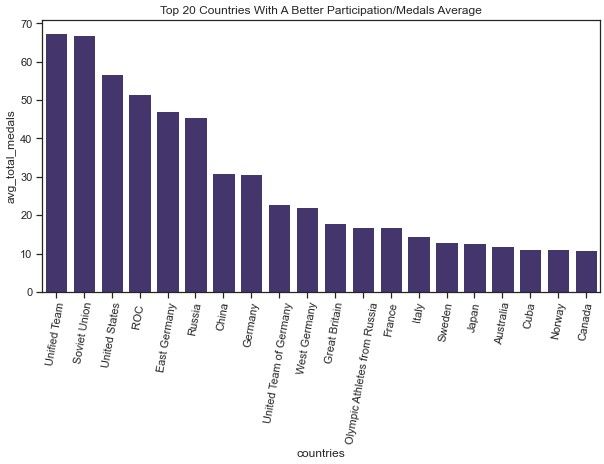
It's worth noting that Germany has participated in the Games as different names in their history (West Germany, East Germany, United Team of Germany, and Germany). Similarly, Russia has competed as Unified Team, Soviet Union, ROC, and Olympic Athletes from Russia. If we take this into account, we can see that the most 'efficient' countries at winning medals are Russia, USA, Germany, and China.
That's all for this one! Until next time,
Pete


