
Jet Reports gives the user a great deal of freedom and flexibility to create insightful reports in the familiar environment of Microsoft Excel. However, there’s always a downside to so much freedom and usually that’s not realising you’ve created a monster report that takes an age to run. (The boiling frog analogy springs to mind)
Some reports can run in a matter of seconds, but if it is not built following ‘best practice’ guidelines, over time it can grow into an unoptimised mess that takes MUCH longer to run. This article will explore some of the most impactful ways to streamline a Jet report.
#1 Before you start, remove the bloat!
Oftentimes, reports grow into monsters over a long period of time. As more people ask the you to add other (often needless, or ‘soon-to-be-ignored’) features, pull other data fields into the report, or tell you about ‘that one time’ exception that needs to be built in, the report can grow into an ugly mess. The best way to start your optimisation process is by identifying this ‘fat’ that has built up on the report over time, and chop it out. Don’t pull unneeded and unnecessary data!
#2 Static Report vs. Replicating Report
It’s common to see people enter static, hard-typed data and then apply a Jet NL() or GL() function to each of the hard-typed cells to get data from the ERP. An example of this is below which shows a list of products, their inventory levels, and the amount on sales orders:
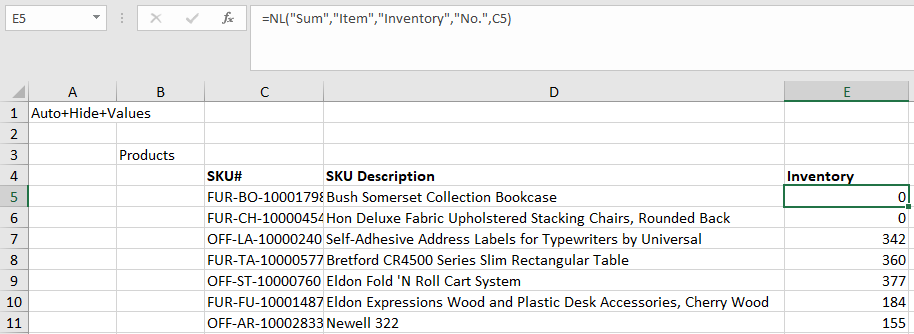
All of the product codes and their descriptions have been typed in manually. Then, the Jet function NL() has been used on each row to pull in the inventory level. Running the report like this would cause Jet to send each query separately to the ERP in order to get the data which is not the most streamlined approach.
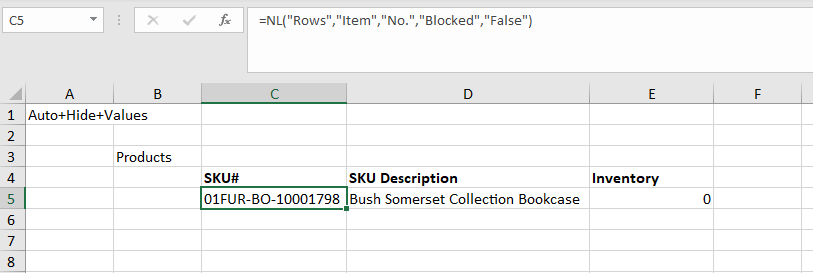
A faster method is by turning this into a ‘replicating report’. The below shows the Jet NL(”Rows”) function to gather a list of all active SKUs:
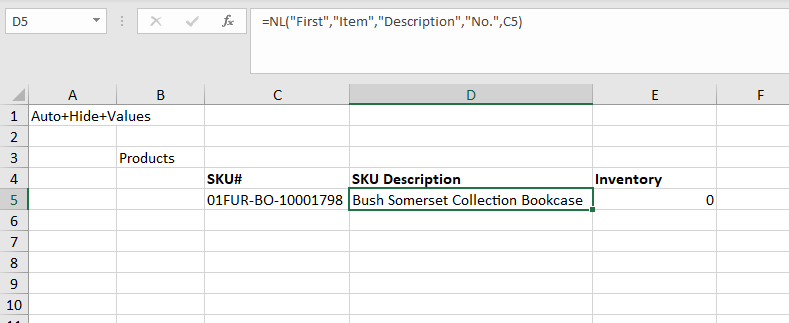
Then, we can use the Jet NL() function to bring in the item description:
And finally, we can show the inventory level:
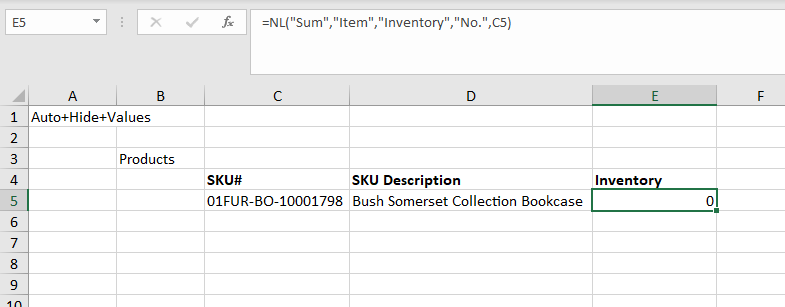
Why does this work?
Essentially, we now have THREE Jet functions for each product code so you’d expect this to run slower than the static report. However, this replicating report will run considerably faster due to the way that communications between ERP databases and Jet/Excel work.
Be mindful if you do start adding more and more NL() functions to this, especially ones to other tables in your db. There is a point where the balance tips in the other direction.
If you need to filter your report based on information from a different table then you should be using LINK= (or you could use NL(Filter) but it’s generally not as fast). If you find you’re pulling information from the same table, the following tip will speed up your report run time.
For more information on filtering from another table, read the following article: Jet Reports 101 - NL(Filter) vs. Link=
#3 Replace NL() with NF() where possible
It’s easy to get used to the most common Jet function NL(), but take note of whether you’re pulling from the same data source/table on multiple occasions. It is much faster to use NL() functions to retrieve record keys rather than separate unique values.
Every NL() function makes a request to the database, whereas NF() doesn’t.
For example, pulling information from the Item card can be done by putting in B2, =NL(”Rows”,”Item”), then ‘daisy chain’ each NF() to that:
=NF($B2,”Item No.”) and =NF($B2,”Description”), etc.
#4 NP(”Eval”) is your new best friend
Avoid using volatile Excel functions such as NOW(), TODAY(), RANDBETWEEN(), etc.
A ‘volatile function’ in Excel are functions in which the value cannot be assumed to be the same from one moment to the next. Excel reevaluates cells that contain volatile functions, together with all dependents, every time that has to recalculate. If too much reliance is put on volatile functions, it can make recalculation times slow in Excel alone - when you couple that with Jet reporting it can compound the issue further because Jet Reports makes large numbers of changes to the workbook while it runs and each of those changes can cause a recalculation of the entire worksheet if you have a volatile function on the same worksheet.
This is where NP(Eval) comes to the rescue as it is designed for use when working with volatile Excel functions.
If you do use them, make sure they are "wrapped" inside an NP("Eval") function, e.g., =NP("Eval","=NOW()"). This will avoid constant recalculation, which would cause a major performance problem.
A full article on the use of NP(Eval) is coming in the future.
#5 Avoid Conditional Hide where possible
Avoid using conditional hides to eliminate large amounts of data in a spreadsheet. In many cases, if you use an appropriate filter it will eliminate the data you do not want to see. No need to bring in data that’s only going to be hidden as it’s irrelevant, filter it out from the query at the start!
As previously mentioned, if you need to filter your report based on information from a different table then you should be using LINK= (or you could use NL(Filter) but it’s generally not as fast).
Hopefully you’ve found something useful in this article or it’s at least given you a refresher on some of the tactics to building best practice methods into your Jet Report building process.
Have other tips you’ve found? Drop me a message! What’s your favourite optimisation hack?


