Importing Tools:
import pandas as pd
import numpy as np
import matplotlib.pyplot as plt
%matplotlib inline
import matplotlib.patches as mpatches
from matplotlib.pyplot import figure
Reading in the data:
data = pd.read_csv('data\KCC_Libraries.csv')Taking a quick look at the dataset:
data.head(5)| district | location | 0-11 | 12-19 | 20-59 | 60+ | other | total_borrowers | number_of_borrowed_items | computer_hours | number_of_visits | items_in_stock | staffing_costs | premises_costs | other_costs | total_costs | number_of_birth_and_death_registrations | |
|---|---|---|---|---|---|---|---|---|---|---|---|---|---|---|---|---|---|
| 0 | Tunbridge Wells | Cranbrook | 158 | 15 | 167 | 285 | 59 | 684 | 9866 | 167 | 2776 | 16850 | 17064 | 31317 | 16851 | 65232 | 3 |
| 1 | Thanet | Margate | 36 | 6 | 92 | 139 | 34 | 307 | 2502 | 376 | 2550 | 35477 | 35582 | 67085 | 35477 | 138144 | 24 |
| 2 | Canterbury | Whitstable | 112 | 8 | 139 | 259 | 51 | 569 | 4248 | 83 | 1337 | 25927 | 26095 | 40761 | 25927 | 92783 | 290 |
| 3 | Shepway | Hythe | 137 | 14 | 159 | 538 | 140 | 988 | 14108 | 485 | 3172 | 23627 | 23818 | 47713 | 23628 | 95159 | 399 |
| 4 | Dover | Dover | 118 | 17 | 172 | 338 | 63 | 708 | 7366 | 859 | 2765 | 51955 | 52156 | 149644 | 51956 | 253756 | 594 |
data.groupby(['district']).sum().sort_values('items_in_stock', ascending=False)0-11 | 12-19 | 20-59 | 60+ | other | total_borrowers | number_of_borrowed_items | computer_hours | number_of_visits | items_in_stock | staffing_costs | premises_costs | other_costs | total_costs | number_of_birth_and_death_registrations | |
|---|---|---|---|---|---|---|---|---|---|---|---|---|---|---|---|
| district | |||||||||||||||
| Maidstone | 635 | 132 | 723 | 874 | 271 | 2635 | 30654 | 1717 | 8512 | 208251 | 209116 | 394503 | 208253 | 811872 | 4166 |
| Thanet | 362 | 60 | 643 | 1237 | 308 | 2610 | 29631 | 2462 | 9416 | 152352 | 153105 | 422980 | 152354 | 728439 | 3385 |
| Sevenoaks | 773 | 144 | 795 | 946 | 222 | 2880 | 36524 | 1506 | 45765 | 138721 | 139708 | 251357 | 138723 | 529788 | 2557 |
| Tonbridge & Malling | 649 | 117 | 709 | 833 | 231 | 2539 | 32673 | 1529 | 8406 | 134760 | 135656 | 187196 | 134762 | 457614 | 2062 |
| Canterbury | 597 | 94 | 960 | 1582 | 280 | 3513 | 39616 | 2301 | 13325 | 132585 | 133704 | 331979 | 132587 | 598270 | 3716 |
| Dover | 280 | 66 | 491 | 1222 | 223 | 2282 | 27249 | 1966 | 6194 | 131149 | 131717 | 292365 | 131151 | 555233 | 1680 |
| Swale | 447 | 74 | 611 | 969 | 276 | 2377 | 33172 | 2155 | 10835 | 124258 | 124994 | 160675 | 124260 | 409929 | 1788 |
| Tunbridge Wells | 448 | 91 | 526 | 698 | 214 | 1977 | 25440 | 1621 | 6371 | 119155 | 119792 | 267544 | 119157 | 506493 | 2994 |
| Shepway | 345 | 55 | 446 | 943 | 266 | 2055 | 24546 | 2058 | 7324 | 117771 | 117842 | 227093 | 117773 | 462708 | 2188 |
| Gravesham | 263 | 109 | 423 | 565 | 160 | 1520 | 15697 | 2393 | 7386 | 117354 | 117845 | 166156 | 117356 | 401357 | 2161 |
| Dartford | 314 | 109 | 339 | 313 | 117 | 1192 | 12724 | 1863 | 5837 | 112125 | 112528 | 170247 | 112127 | 394902 | 2538 |
| Ashford | 345 | 96 | 451 | 781 | 150 | 1823 | 18957 | 1835 | 4684 | 95965 | 96510 | 246297 | 95967 | 438774 | 2810 |
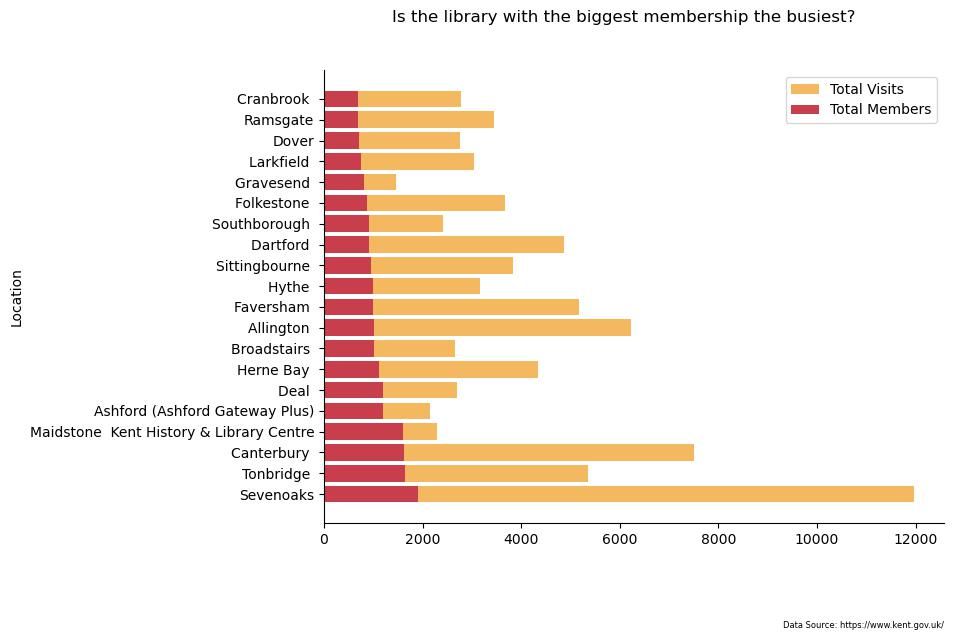
Is the biggest library also the busiest?
big_libraries = data.sort_values("total_borrowers", ascending=False)[
    ["location", "total_borrowers", "number_of_visits"]
].head(20)
plt.figure(figsize=(8, 6), dpi=100)
plt.barh(
big_libraries["location"],
big_libraries["number_of_visits"],
color="#F4B860",
label="Total Visits",
)
plt.barh(
big_libraries["location"],
big_libraries["total_borrowers"],
color="#C83E4D",
label="Total Members",
)
plt.gca().spines["top"].set_visible(False)
plt.gca().spines["right"].set_visible(False)
plt.legend()
plt.ylabel("Location")
plt.suptitle("Is the library with the biggest membership the busiest?")
plt.figtext(
0.9,
-0.05,
"Data Source: https://www.kent.gov.uk/",
horizontalalignment="right",
fontsize=6,
)
plt.savefig("Biggest_Busiest.jpg", bbox_inches="tight")
plt.show()
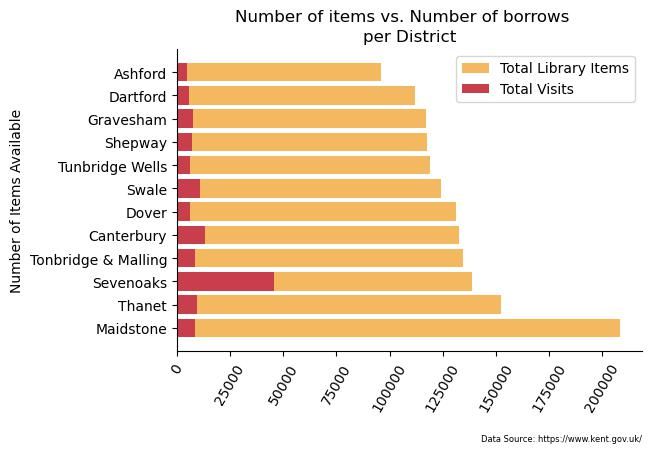
total_items = (
    data.groupby("district")
    .sum()
    .sort_values("items_in_stock", ascending=False)
    .reset_index()[["district", "items_in_stock", "number_of_visits"]]
)
total_items
plt.figure(dpi=100)
plt.barh(
    total_items.district,
    total_items.items_in_stock,
    color="#F4B860",
    label="Total Library Items",
)
plt.barh(
    total_items.district,
    total_items.number_of_visits,
    color="#C83E4D",
    label="Total Visits",
)
plt.gca().spines["top"].set_visible(False)
plt.gca().spines["right"].set_visible(False)
plt.legend()
plt.ylabel("Number of Items Available")
plt.suptitle("Number of items vs. Number of borrows")
plt.title("per District")
plt.figtext(
    0.9,
    -0.1,
    "Data Source: https://www.kent.gov.uk/",
    horizontalalignment="right",
    fontsize=6,
)
plt.xticks(rotation=60)
plt.savefig("Items_Borrows.jpg", bbox_inches="tight")
plt.show()
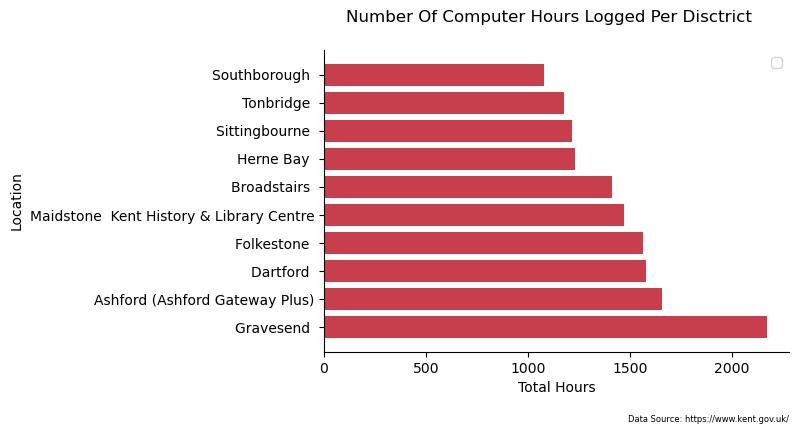
computers = data.sort_values("computer_hours", ascending=False).head(10)[
    ["location", "computer_hours"]
]
plt.figure(dpi=100)
plt.barh(computers["location"], computers["computer_hours"], color="#C83E4D")
plt.gca().spines["top"].set_visible(False)
plt.gca().spines["right"].set_visible(False)
plt.legend()
plt.ylabel("Location")
plt.xlabel("Total Hours")
plt.suptitle("Number Of Computer Hours Logged Per Disctrict")
plt.figtext(
    0.9,
    -0.05,
    "Data Source: https://www.kent.gov.uk/",
    horizontalalignment="right",
    fontsize=6,
)
plt.savefig("Computer_Hours.jpg", bbox_inches="tight")
plt.show()
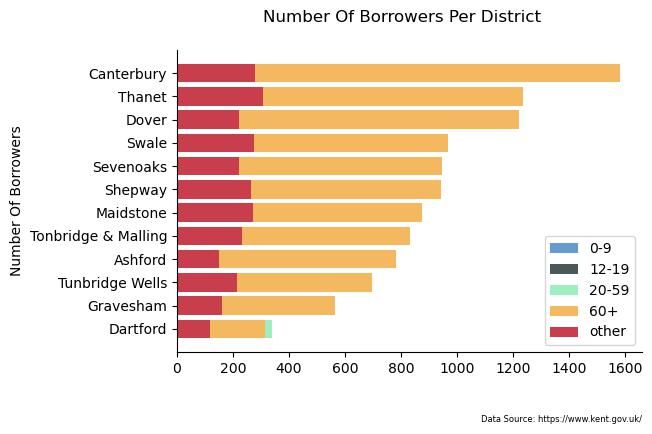
ages_by_district = (
    data.groupby("district")
    .sum()
    .reset_index()
    .sort_values("60 ", ascending=True)[
        ["district", "0-11", "12-19", "20-59", "60 ", "other", "total_borrowers"]
    ]
)
plt.figure(dpi=100)
plt.barh(
    ages_by_district["district"], ages_by_district["0-11"], color="#6699CC", label="0-9"
)
plt.barh(
    ages_by_district["district"],
    ages_by_district["12-19"],
    color="#4A5859",
    label="12-19",
)
plt.barh(
    ages_by_district["district"],
    ages_by_district["20-59"],
    color="#A0EEC0",
    label="20-59",
)
plt.barh(
    ages_by_district["district"], ages_by_district["60 "], color="#F4B860", label="60 "
)
plt.barh(
    ages_by_district["district"],
    ages_by_district["other"],
    color="#C83E4D",
    label="other",
)
plt.gca().spines["top"].set_visible(False)
plt.gca().spines["right"].set_visible(False)
plt.legend()
plt.ylabel("Number Of Borrowers")
plt.suptitle("Number Of Borrowers Per District")
plt.figtext(
    0.9,
    -0.05,
    "Data Source: https://www.kent.gov.uk/",
    horizontalalignment="right",
    fontsize=6,
)
plt.savefig("District_Ages.png", bbox_inches="tight")
plt.show()